The document will explain how can we use Change Data Control (CDC) for handling data vicissitudes in Salesforce. We can customize the data changes of any sObject and sent out The client. It fortifies an asynchronous mode to accumulate transmuted data which we call the change pointer and sent out to the client. The main difference to the streaming API of Salesforce is that data can be bulk as astronomically immense data. Furthermore, customers can liberatingly schedule when the data will be sent e.g. every 5 minutes, 30 minutes, etc… With this feature, the customer doesn’t require to develop such an app to amass data change and sent out to the client. Just use SKYVVA CDC.
What is CDC Control Board?
CDC Control Board is a dashboard where we can monitor Change Pointer, Interfaces and Scheduler. Each tab holds different functionality. Change Pointer is a table that stores change pointer records. So we can facilely monitor them on Change Pointer table in CDC Control Board rather than on the Integration Admin tab. This withal applies for Interfaces and Schedulers tab.
What is the CDC Control Board? #
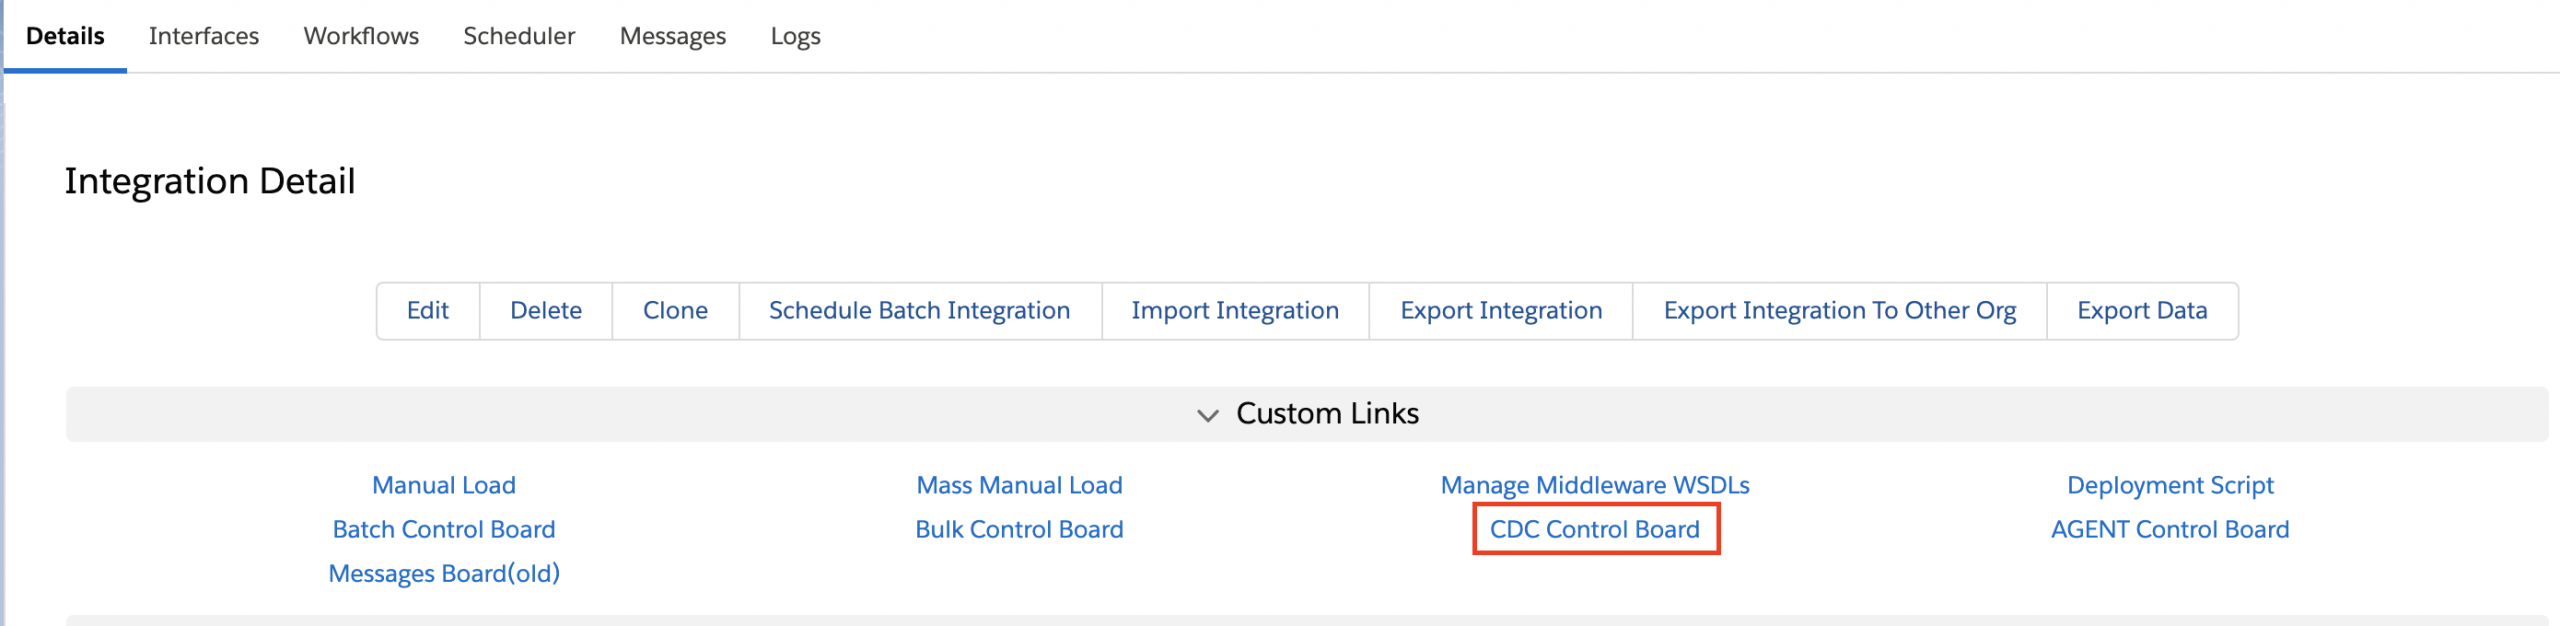
CDC Control board is the dashboard where you can monitor Change Pointer, Interfaces, Interface Group, Queues, Scheduler, and Alert. Each tab holds different functionality. CDC Control Board exists in the Custom Link section on the integration detail page.
CDC Tabs #
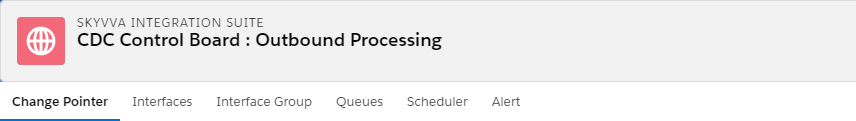
When you open the CDC Control board you will find 6 tabs available which are Change Pointer, Interfaces, Interface Group, Queues, Scheduler and Alert. Each tab has different functions and displays things relatable with CDC. The following will explain more detail about each tab:
Change Pointer
Change Pointer is a table that stores change pointer records. The records are created by the CDC Processing, Process Builder, and CP Query Editor. The Change Pointer records will store here until you set the scheduler (CDT) to transfer them to the external system. Likewise, you can select all the records and send them manually by using the “Send” button. Change Pointer tab display filter that you can search for CP records base on the criteria you set.
To monitor Change Pointer, just simply:
- Go to Change Pointer tab
- Filter the Integration Name, Interface Name and the status of the record you want to display
- Click on the “Search” button. The result will display according to the status you set
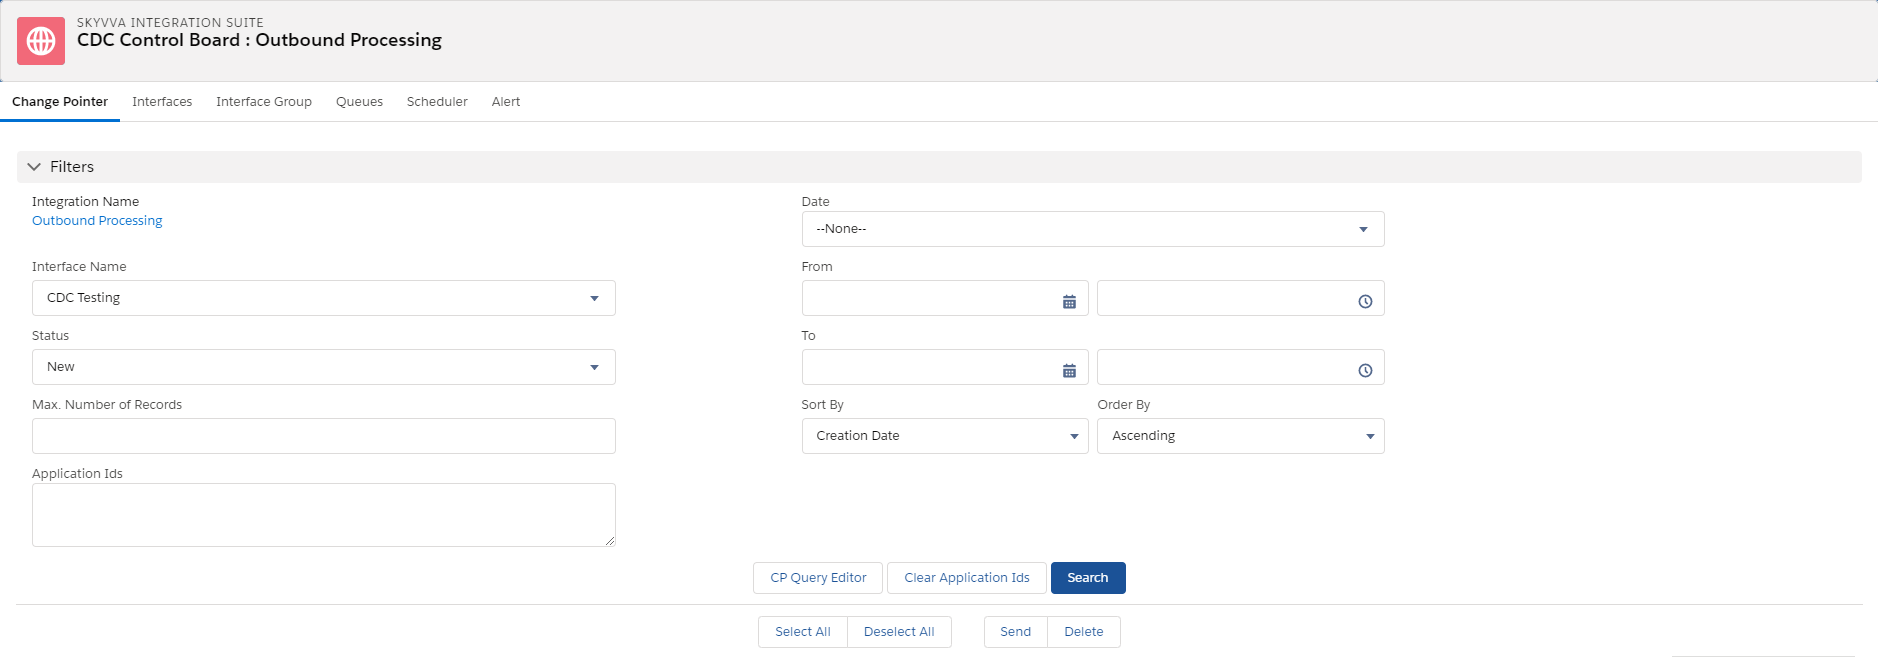
The following tables describe detail about Filters and buttons:
| Filters | Description |
| Interface Name | Outbound Interface on which CDC configured. |
| Status | Two types of status. New and |
| Max Number of Record | Filter on the number of records. |
| Application Id | Application Id is the sObject Id. |
| Date | Filter on created or modified date |
| Sort by & Order by | Sort by creation date. Filter on Ascending or descending. |
| Buttons |
Description |
| CP Query Editor | To create change pointer records |
| Clear Application Ids | All the application Ids will be clear after you click this button. |
| Search | If you click this button the change pointer records will be display |
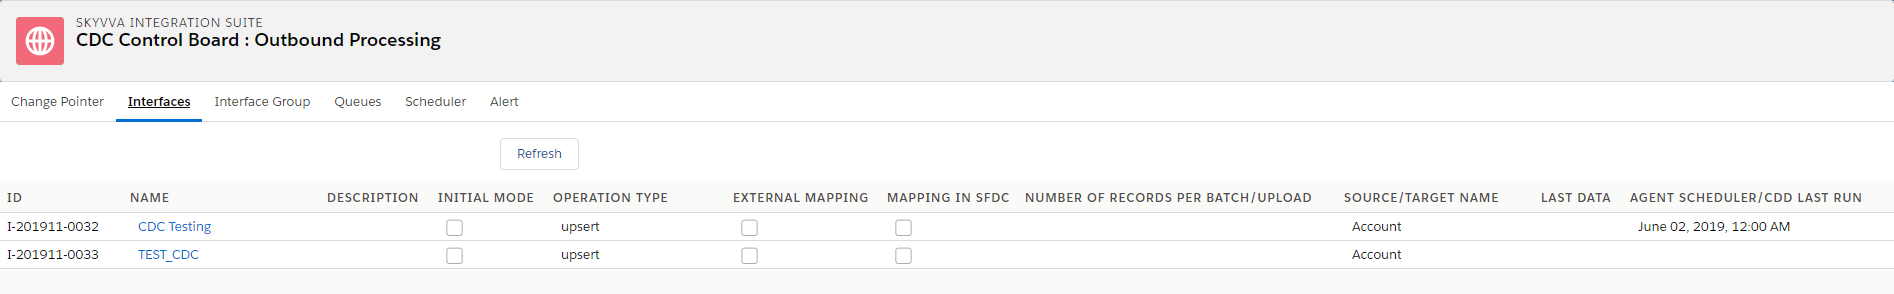
Interfaces
The Interface tab displays only interfaces which has the flag “Use Skyvva Outbound Schedule” set. This tab displays the interfaces that store in an Integration. You can easily check or monitor them. If you land on CDC Control board, just simply click on interface tab then you will see all the interfaces. However, this tab is not editable like the Interface tab in the Integration detail page.
Interface Group
An interface group is a unit to the group where logical interfaces come together. For example, you can group interfaces that are cognate to each other e.g. Account and Contact to one interface group.
There is two kinds of interface group:
=>Business related logical group
=>Technical group
This tab is used to display Interface Group.
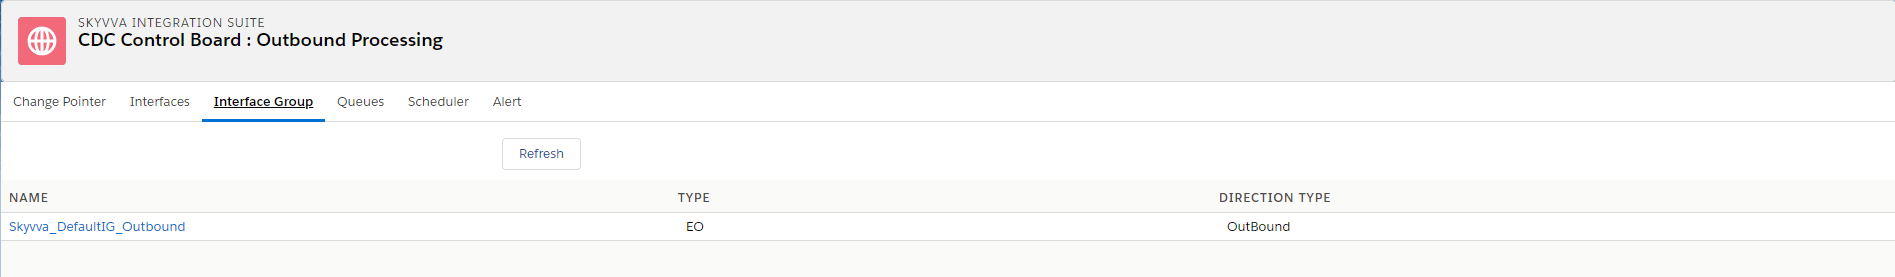
We can apply this filter to probe data referring to a concrete interface group.
Queues
This tab displays the CDC Queues and you can search queues by different filters like Interface Group, Interface Name, and Status. Queue inherit the priority from their interface group and thus a Queue will be a Prio-High, Prio-Medium or Prio-Low Queue.
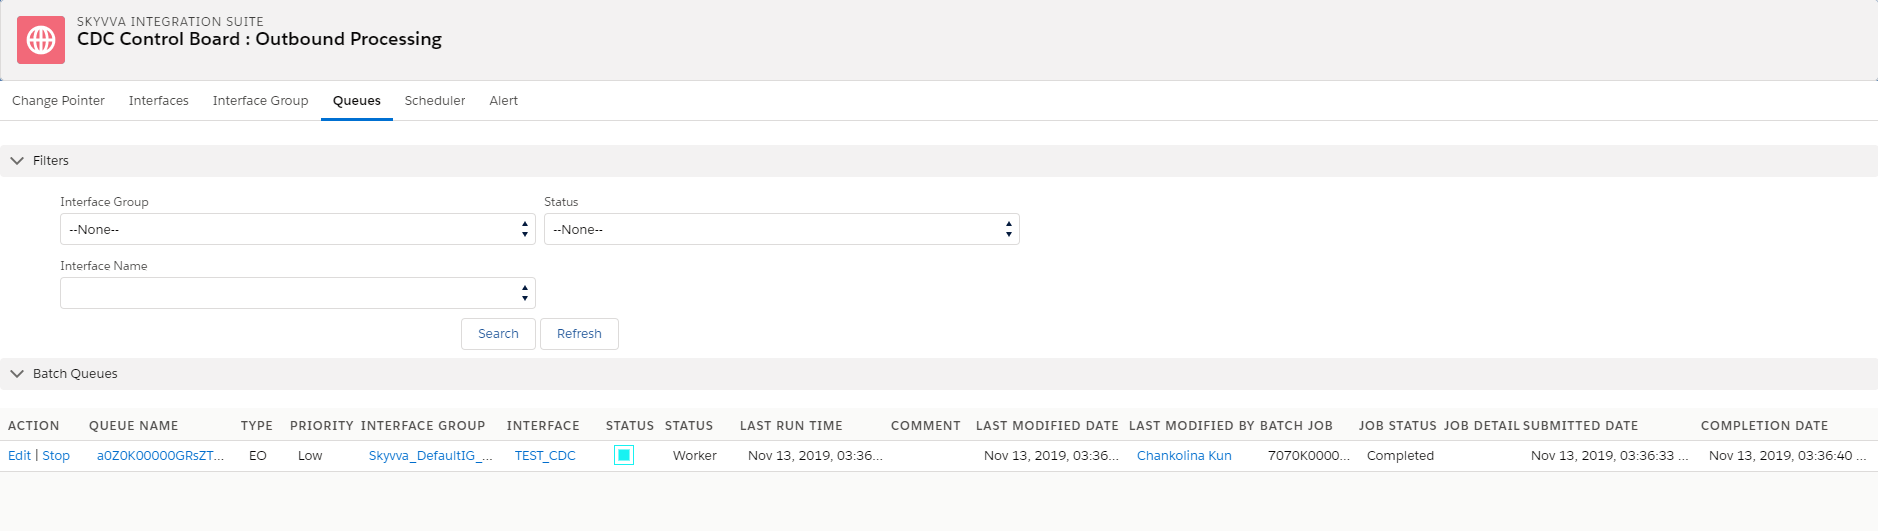
Queue Status:
Status Worker
This status is a temporary status set by the scheduler. Customarily most of the status is set by the worker because the worker is the one who does the job of processing the data package/queue passed from the scheduler.
This status is a helpful token that the scheduler has passed the data package/queue to the worker. When the worker starts to process the data package/queue it will transmute the status from “Worker” to “Running”.
Status Running
This status is set by the worker. When a data package/queue is passed from the scheduler to the worker the status of this queue is “Worker”. Then the worker transmutes the status from “Worker” to “Running”.
The following change from status “Running” can be transpired.
If the queue is processed prosperously then the status will set to “Ready”. This is valid for both queue type e.g. for EO- and EOIO-Queue.
If an error occurred for whatever reason then the status is set to “Failed” for an EO-Queue and to “Hold” for an EOIO-Queue.
Status Failed
This status is set when processing a data package/queue got failed. This status is only utilized for the EO-Queue. For the EOIO-Queue the status can be used is “Hold” and not failed. If the processing of the EO-Queue is not ceased plenarily this status reflect an ephemeral status and can be set for example to “Ready” when next time the processing is prosperous.
Processing an EO-Queue is not blocked if error encountered for EOIO-Queue. Because the nature of EO-Queue is overtaken of data which can be transpired and that we already understood when defining interface group/queue with the type EO.
Status Hold
This status is set when processing a data package/queue got failed. This status is only utilized for the EOIO-Queue. For the EO-Queue the status can be used is “Failed” not hold. If the status is set to “Hold” then the processing of this queue is ceased because we can create an overtaken of data.
There is a reprocess mechanism of the affixment by the affixment reprocess scheduler. Refer to chapter “10 Variant of scheduler” for understanding the variant of the scheduler.
For some error, the reprocess can resolve the error and ergo will reset the status of the queue to “Ready”. Then the blocking of the queue will be relinquished. In some circumstances, because the error cannot be resolved automatically we will require the administrator to resolve the error situation and reset the queue status manually.
Stop by Admin
This status results from an admin action. An admin may want to stop the queue because of maintenance work. Another reason could be that we don’t opt that the queue X should be processed and ergo we intentionally stop this queue. This is for example because we opt to have more resources for processing other queues than queue X.
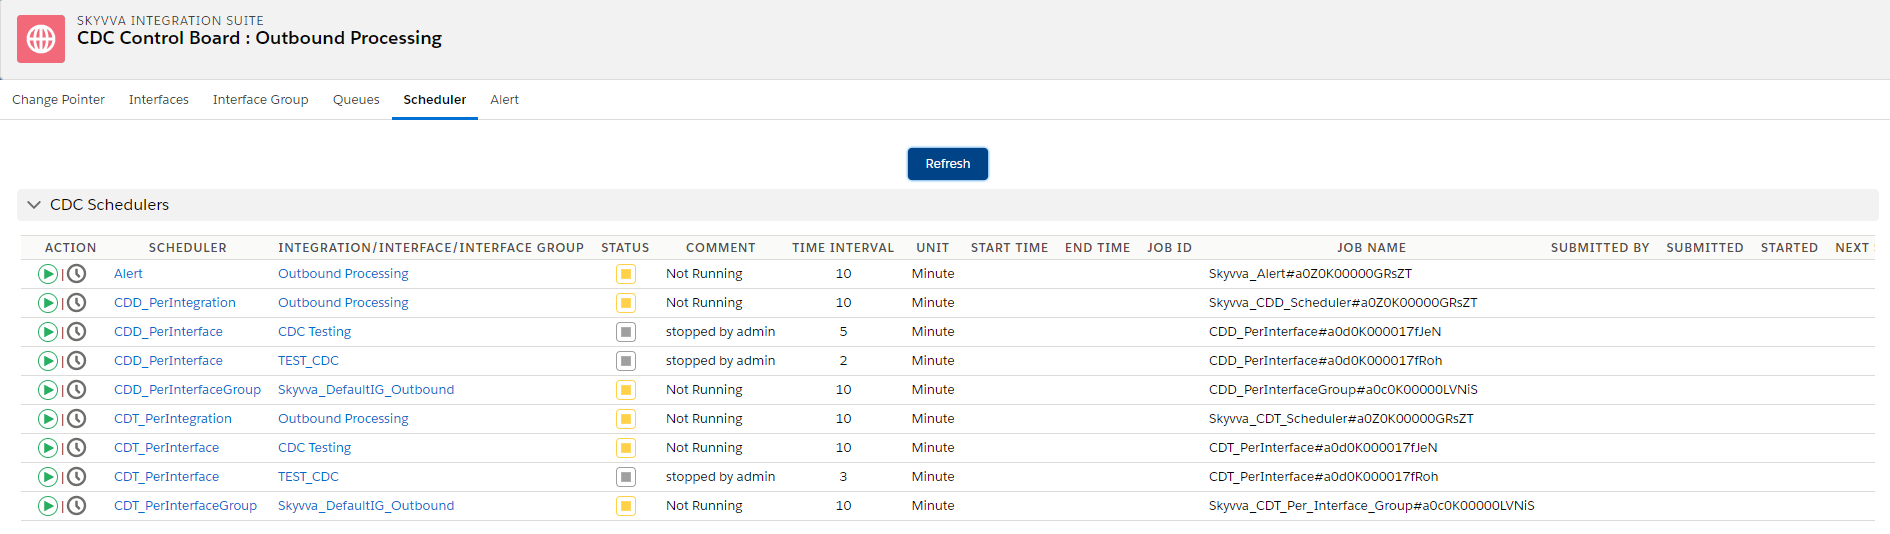
Scheduler
There are some schedulers available in the Scheduler tab which are Change Data Detection (CDD) for Integration, Change Data Transfer (CDT) for Integration and Change Data Transfer SKYWWA DefaultIG Outbound for Interface Group. You can set the time and start the schedule or refresh it.
Note: If you manually create more Interface Group then they will display in the Scheduler tab.
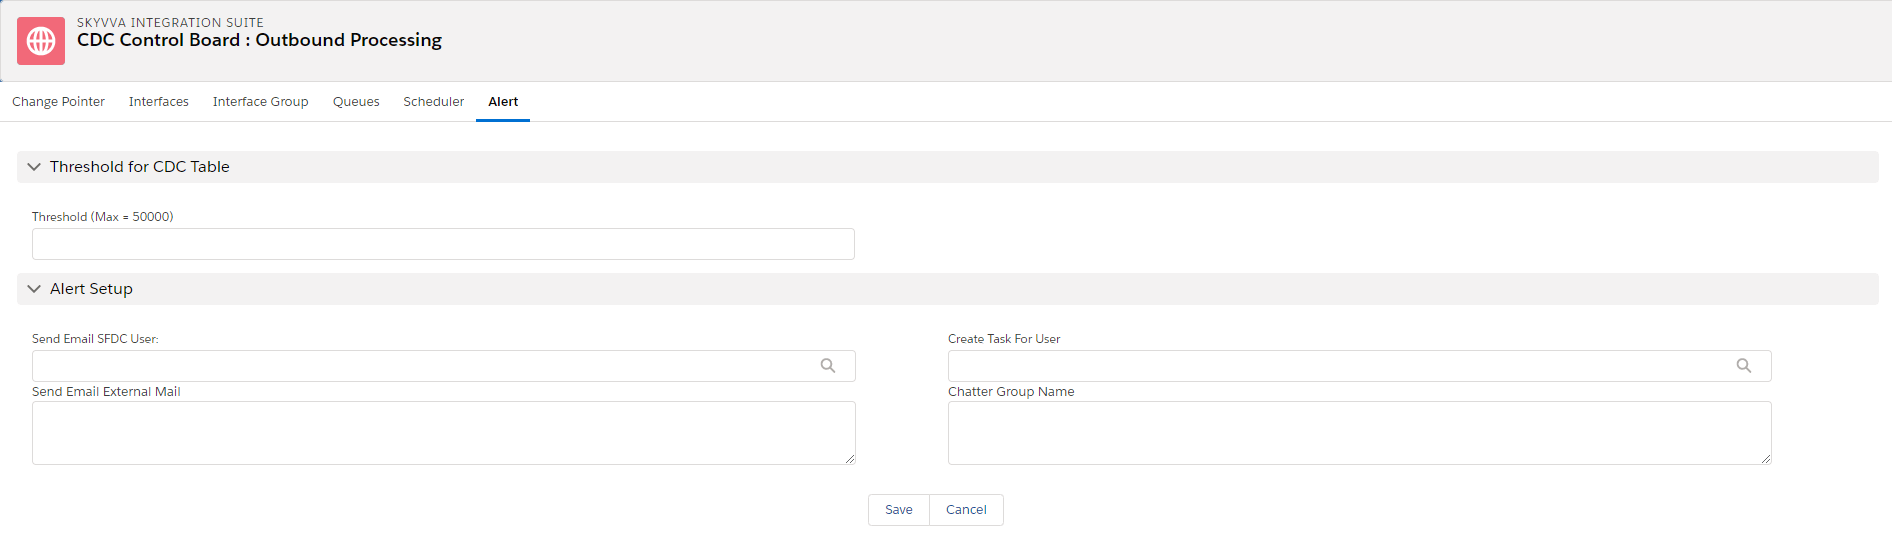
Alert
This alert tab is used for monitoring the CDC table.
If the threshold from the alert tab is smaller than the CDC table value, a notify email will be sent to the assigned alert channels.
We have a different type of alerting rules on the integration & interface level
- Send Email SFDC User
- CreateTask for User
- Send Email External Mails
- Chatter group Name