Change Data Control (CDC) use for handling data change in Salesforce. We can customize the data changes of any sObject and sent out to the client. It provide an asynchronous mode to accumulate transform data which we call the change pointer and sent out to the client. The main difference to the streaming API of Salesforce is that data can be bulk as extremely large data. Furthermore customer can liberatingly schedule when the data will be sent e.g. every 5 minutes, 30 minutes etc… With this feature customer don’t require to develop such an app to amass data change and sent out to the client. Just use SKYVVA CDC.
What is Change Data Control (CDC)? #
With CDC we provide an ability to record all data changes you create on any business object. It will be automatically push to your external system at any time you scheduled. In comparison to the streaming API, you can overcome the limit of sending changes record by record. Here we can bulk and collect changes to be callout in packages meaning that you leverage the best usage of your Salesforce resources. Don’t disturb your online business user while operation hours. Use CDC
Scheduler to schedule data changes to be send out at a time.
CDC is made up of two components, the CDD and the CDT. CDC is stand for Change Data Detection and CDT is stand for Change Data Transfer. These two components has different functionality. CDD is a scheduler which is running to call batch Apex in order to collect data change and save all those data into Change Pointer Object. CDT is another scheduler which is running to collect the records from the Change Pointer Object and sent to the external System such as SAP … etc. The Schedule will executes callout as parallel of future, queueable, batch based on priority, integration resource and interface group type (EO/EOIO).

Terms you should know:
- Use SKYVVVA Outbound Scheduler: This flag use for CDC Processing. When you check this flag, it’s mean that you activate the CDC. It activates both CDD and CDT.
- CDC Mode Only: This field is used for separating the process of CDD and CDT follow flag Use SKYVVA Outbound Scheduler. Select CDD to run only CDD for interface or select CDT to run only CDT. Select None to run both CDD and CDT at the same time.
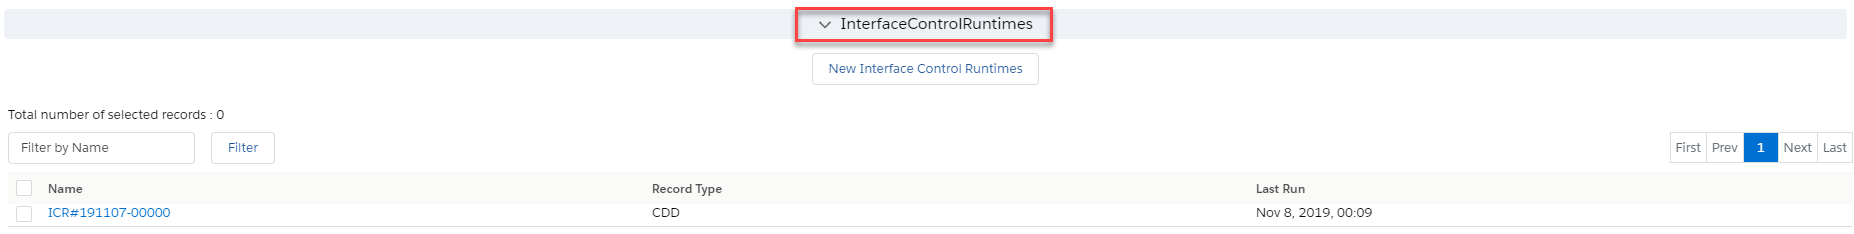
- Interface Control Runtimes: Interface Control Runtime could be used for another purpose. for CDD, it is used where the user can set LastRun DateTime that CDD finds the record change which is record’s LastModifiedDate>that date.
Configuration #
CDC is used for outbound processing only. It is done by:
- Using Adapter
- Using Agent
1. Adapter
An outbound interface can be processed with the different adapters to configure CDC. For example, we use SFDC2SAPPI adapter, Rest Adapter, Soap adapter. Follow the given step to process the outbound interface using the adapter. We are using SFDC2SAPPI adapter as an example, you can follow the given steps:. Follow the given step to process outbound interface using adapter:
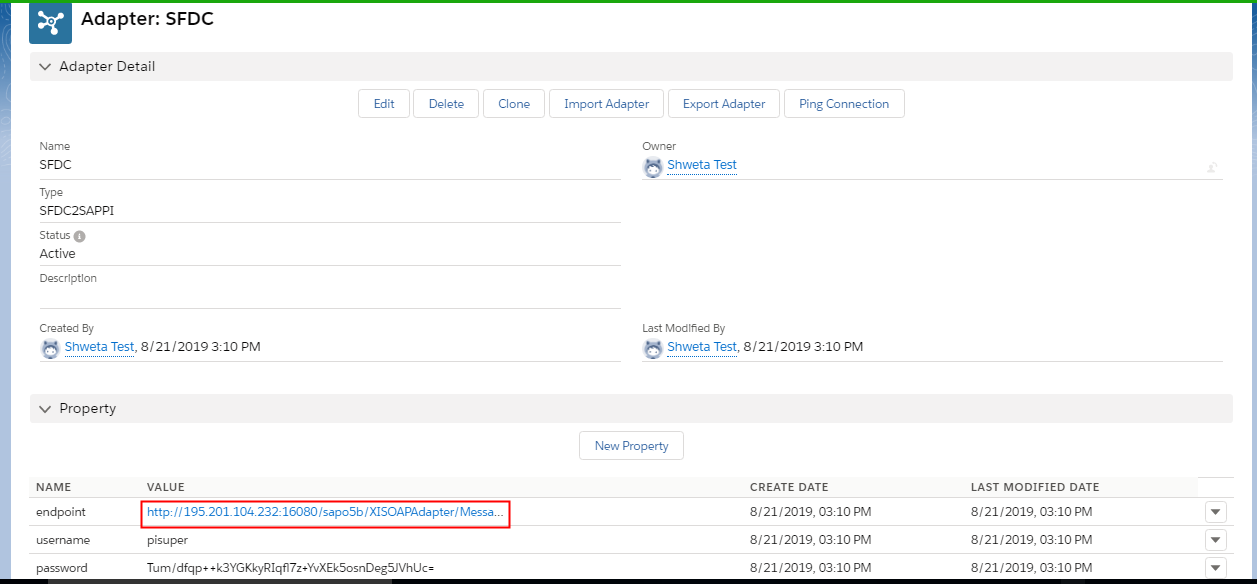
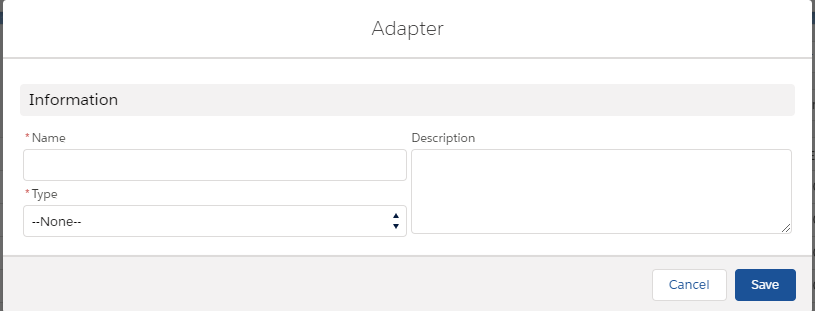
Step1: Create Adapter
We are using SFDC2SAPPI adapter. To create SFDC2SAPPI adapter follow the given steps:
- Go to Adapter tab.
- Click on New Button.
- Fill the username, endpoint and password
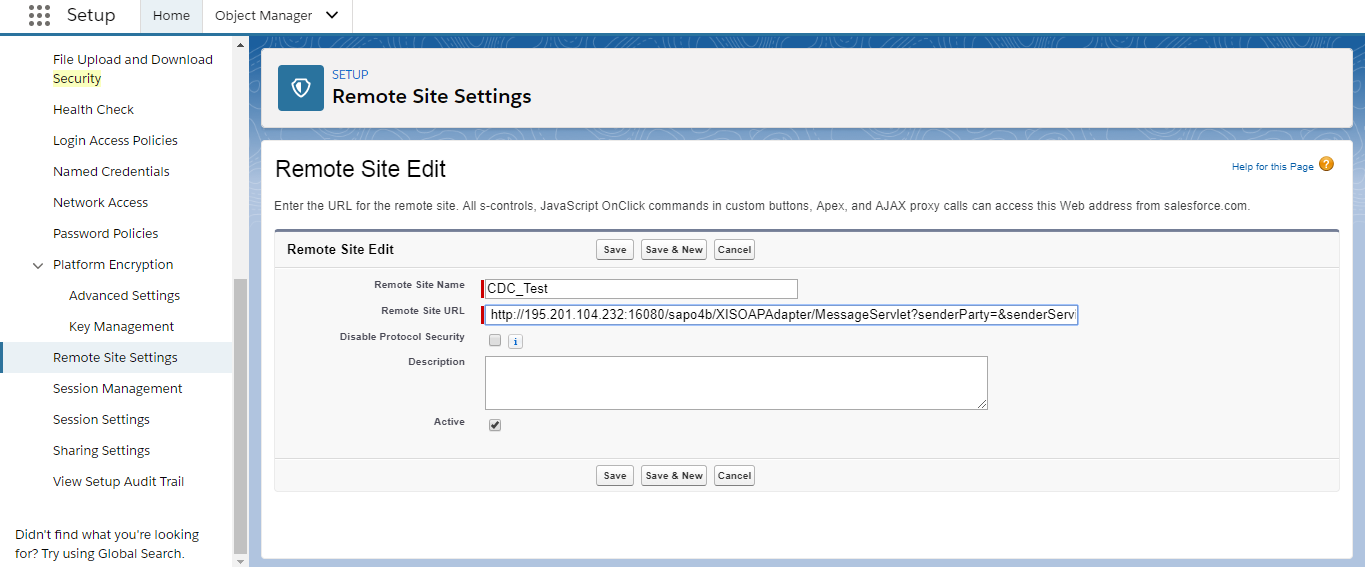
Step2: Create Remote Sites
- From Setup, enter Remote Site Settings in the Quick Find box, then select Remote Site Settings.
- Click New Remote Site.
- Enter a descriptive term for the Remote Site Name.
- Enter the URL for the remote site.
- Optionally, enter a description of the site.
- Click Save.
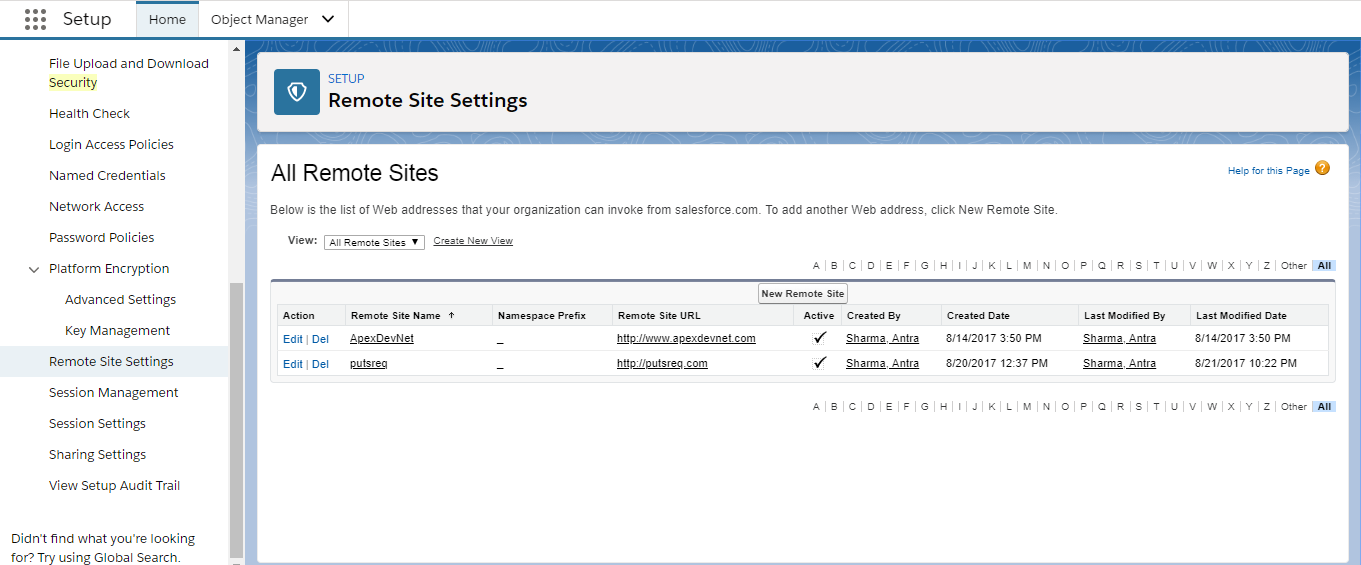
Note: Remote Site URL: Paste the same link as in the Property Value that you have just created a moment ago.
Step3: Create Interface
- Create Integration.
- Create Outbound Interface -Adapter:SFDC2SAPPI
- We have to configure CDC For an Interface.
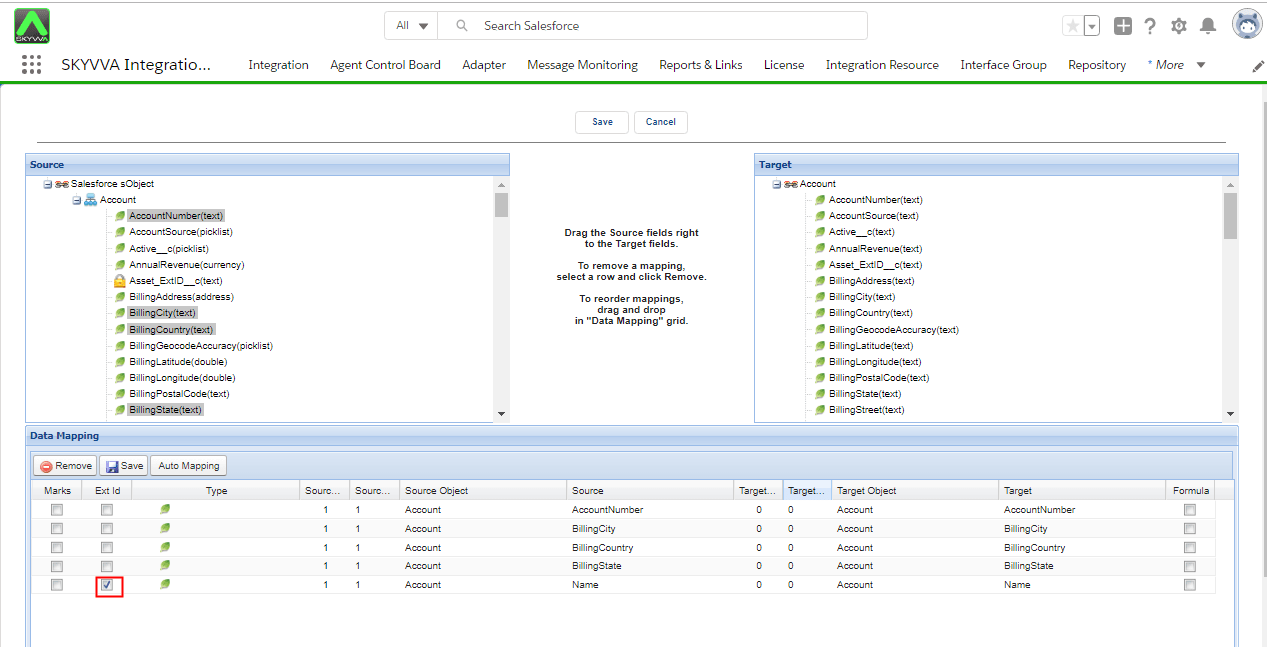
– In order to configure CDC for an Interface We have to open and edit Interface.
– Check “Use Skyvva Outbound Scheduler” checkbox.
- Go to Interface and Click on Related tab -> scroll down the page to Interface Control Runtimes
- Specify the parameters:
LastRun is the date from where we define the changed data to be collected.
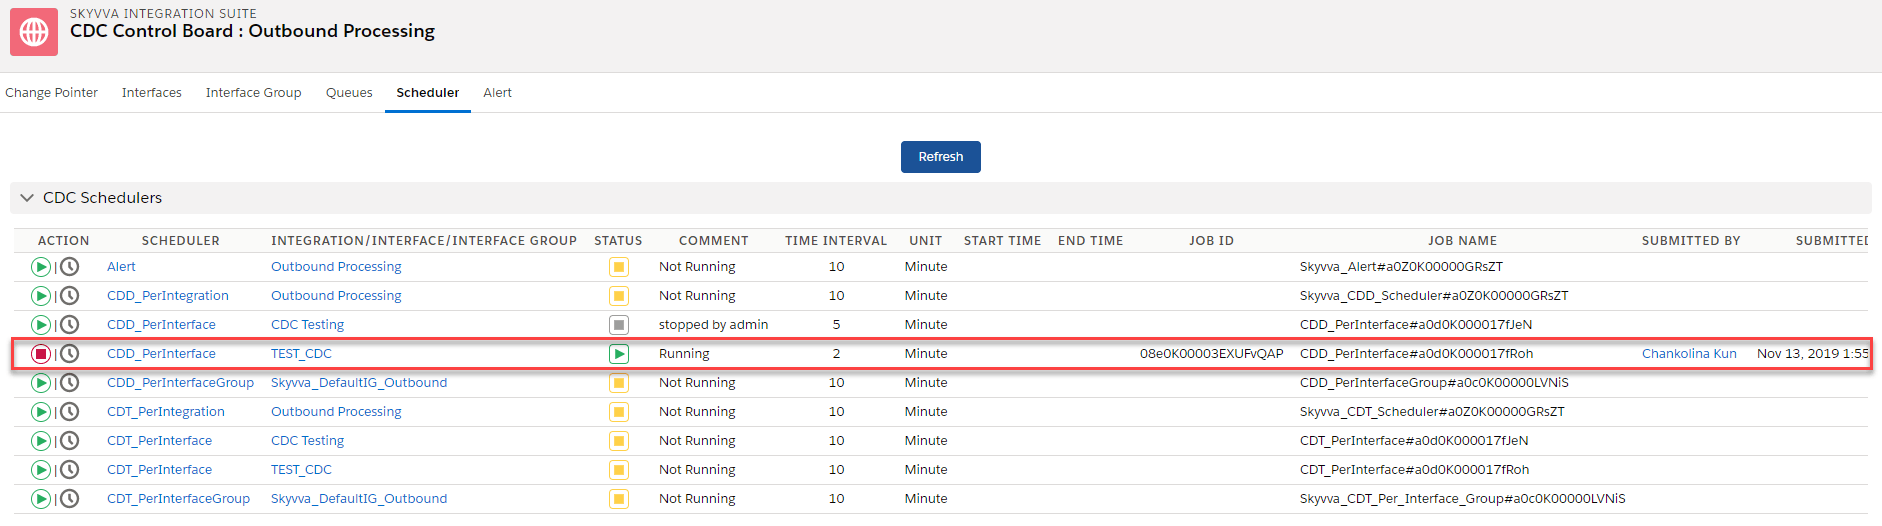
Step4: Scheduled CDD
- Open Integration Details Tab
- Go to custom Link section and click on CDC Control board
- Go to Scheduler tab.
- Start the scheduler on an outbound section and set the time as you prefer.
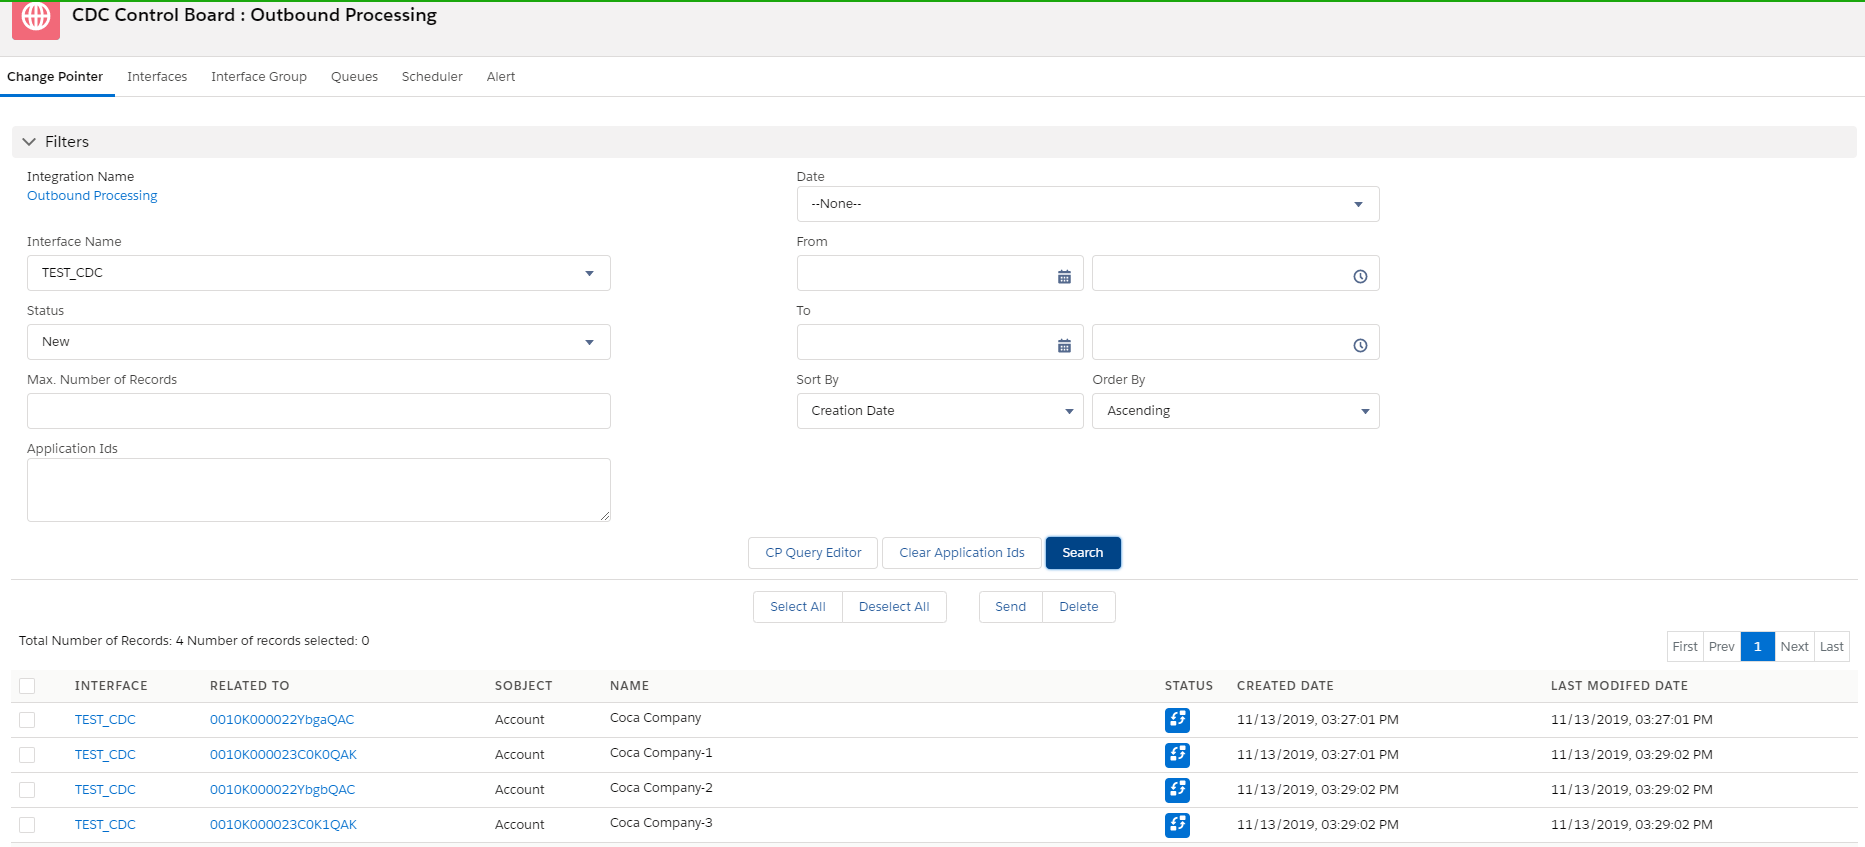
Step5: Monitoring CDD
- Enter Integration Details Tab
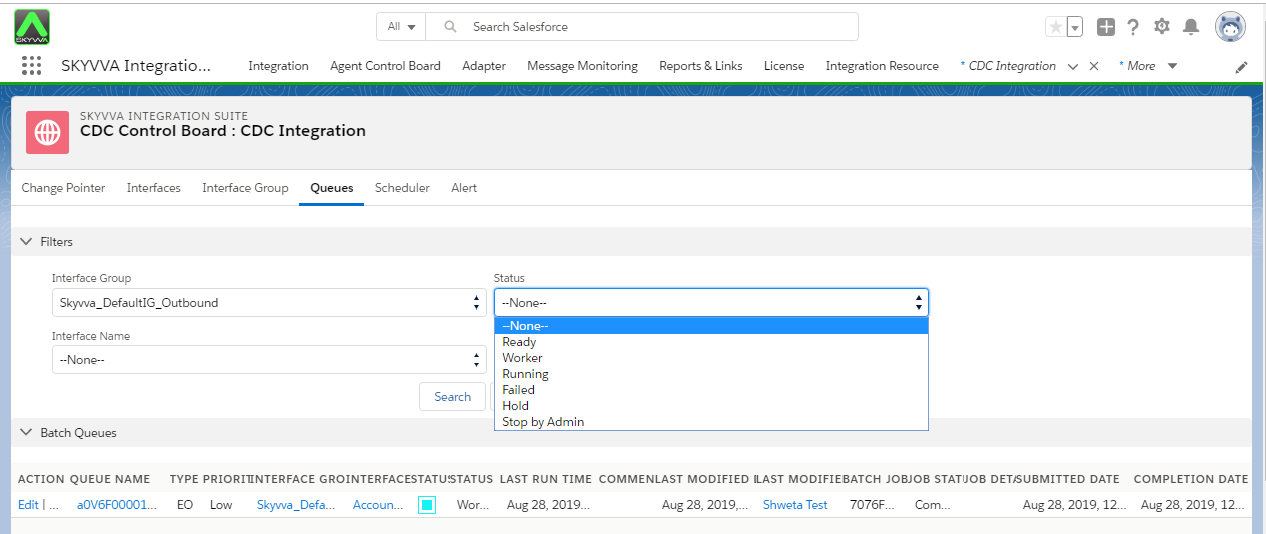
- CDC Control board Tab and apply filter on:
->Integration name
-> Interface Name
-> Status
-> Search
CDC Control Board
When you open the CDC Control board you will find three tabs available which are Change Pointer, Interfaces and Scheduler. Each tabs have different functions and display things relatable with CDC. The following steps will show you how to monitor each tab:
Change Pointer #
Change Pointer is a table which store change pointer records.It written every time a transaction modifies of certain fields.. The records are created by CDD. The records will store here until you set the scheduler (CDT) to transfer them to external system. To monitor Change Pointer, just simply:
- Go to Change Pointer tab
- Filter the Integration Name, Interface Name and the status of record you want to display
- Click on “Search” button. Result will display according to the status you set
We can Apply filters :
| Filters | Description |
| Interface Name | Outbound Interface on which CDC configured. |
| Status | Two type status. New and |
| Max Number of Record | Filter on number of records. |
| Application Id | Application Id is the Sobject Id. |
| Date | Filter on created or modified date |
| Sort by & Order by | Sort by creation date. Filter on Ascending or descending. |
Interface
This tab display the interfaces that store in an Integration. You can easily check or monitor them. If you land on CDC Control board, just simply click on interface tab then you will see all the interfaces. However this tab is not editable like Interface tab in Integration detail page.
Interface Group
Interface group is a unit to group where logical interfaces comes together. For example you can group interfaces which is cognate to each other e.g. Account and Contact to one interface group.
There are two kind of interface group:
=>Business related logical group
=>Technical group
We can apply this filter to probe data referring to concrete interface group.
Queue
Queue inherit the priority from their interface group and thus a Queue will be a Prio-High, Prio-Medium or Prio-Low Queue.
Queue Status:
Status Worker
This status is a temperarory status set by the scheduler. Customarily most of the status is set by the worker because the worker is the one who do the job of processing the data package / queue passed from the scheduler.
This status is a helpful to ken that the scheduler has pass the data package / queue to the worker. When the worker start to process the data package / queue it will transmute the status from “Worker” to “Running”.
Status Running
This status is set from the worker. When a data package / queue is pass from the scheduler to the worker the status of this queue is “Worker”. Then the worker transmute the status from “Worker” to “Running”.
Following change from status “Running” can be transpired.
If the queue is processed prosperously then the status will set to “Ready”. This is valid for both queue type e.g. for EO- and EOIO-Queue.
If an error occurred for whatever reason then the status is set to “Failed” for an EO-Queue and to “Hold” for an EOIO-Queue.
Status Failed
This status is set when processing a data package / queue got failed. This status is only utilized for the EO-Queue. For the EOIO-Queue the status can be used is “Hold” and not failed. If the processing of the EO-Queue is not ceased plenarily this status reflect an ephemerally status and can be set for example to “Ready” when next time the processing of is prosperous.
Processing an EO-Queue is not blocked if error encountered for EOIO-Queue. Because the nature of EO-Queue is overtaken of data which can be transpired and that we already understood when defining interface group / queue with the type EO.
Status Hold
This status is set when processing a data package / queue got failed. This status is only utilized for the EOIO-Queue. For the EO-Queue the status can be used is “Failed” not hold. If the status is set to “Hold” then the processing of this queue is ceased because we can create an overtaken of data.
There is a reprocess mechanism of the affixment by the affixment reprocess scheduler. Refer to chapter “10 Variant of scheduler” for understanding the variant of scheduler.
For some error the reprocess can resolve the error and ergo will reset the status of the queue to “Ready”. Then the blocking of the queue will be relinquished. In some circumstance because the error cannot be resolved automatically we will require the administrator to resolve the error situation and reset the queue status manually.
Stop by Admin
This status results from an admin action. An admin may want to stop the queue because of maintenance work. Other reason could be that we don’t opt that the queue X should be processed and ergo we intentionally stop this queue. This is for example because we opt to have more resource for processing other queues than the queue X.
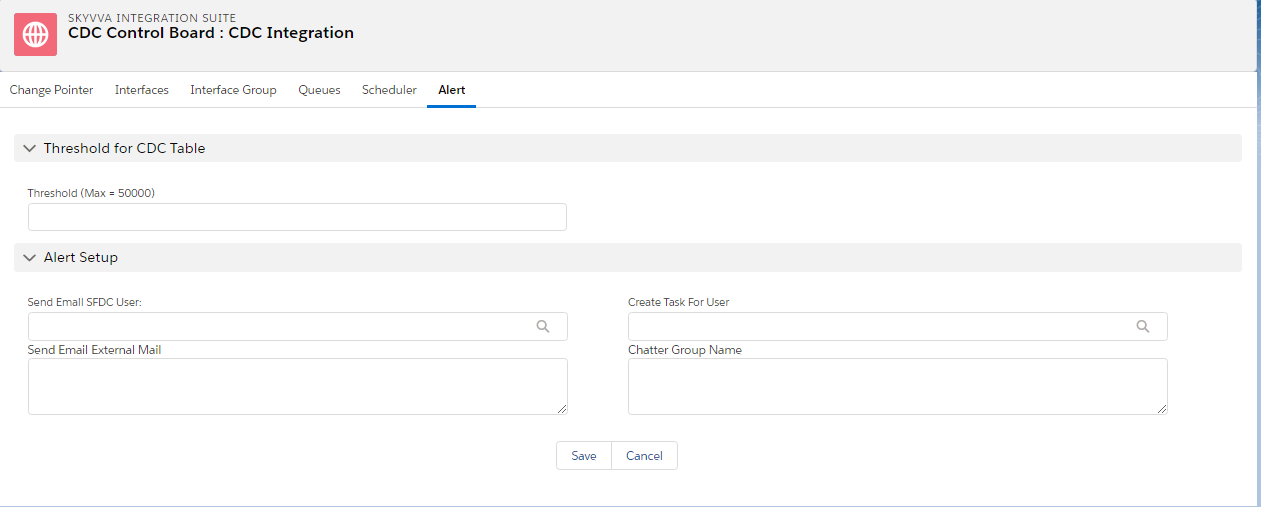
Alert
This alert tab is used for monitoring CDC table. If the threshold from the alert tab is smaller than the CDC table value, a notify email will be sent to the assigned alert channels.
We have different type of alerting rules on the integration & interface level
- Send Email SFDC User
- CreateTask for User
- Send Email External Mails
- Chatter group Name
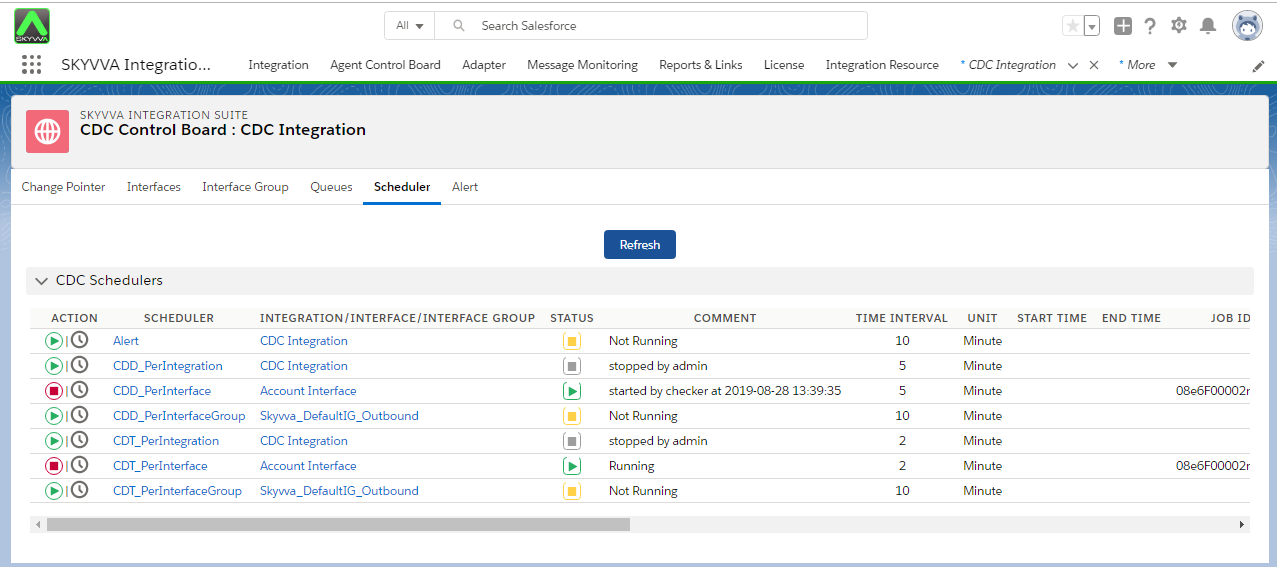
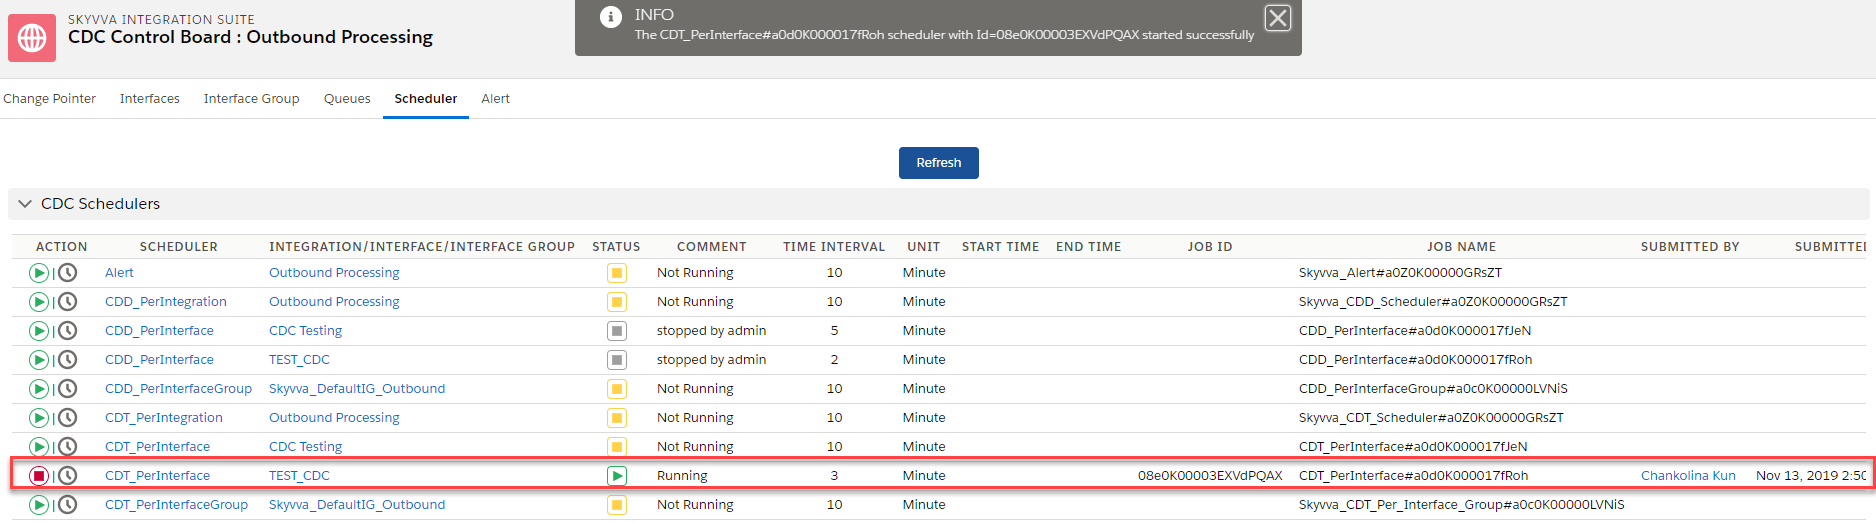
Scheduler
There are some schedulers available in Scheduler tab which are Change Data Detection (CDD) for Integration, Change Data Transfer (CDT) for Integration and Change Data Transfer SKYWWA DefaultIG Outbound for Interface Group. You can set the time and start the schedule or refresh it.
Note: If you manually create more Interface Group then they will display in the Scheduler tab.
Step 6: Schedule CDT
- Go Integration Details Tab
- Go to Scheduler Tab
- Start the Schedule and set the minute as you wish
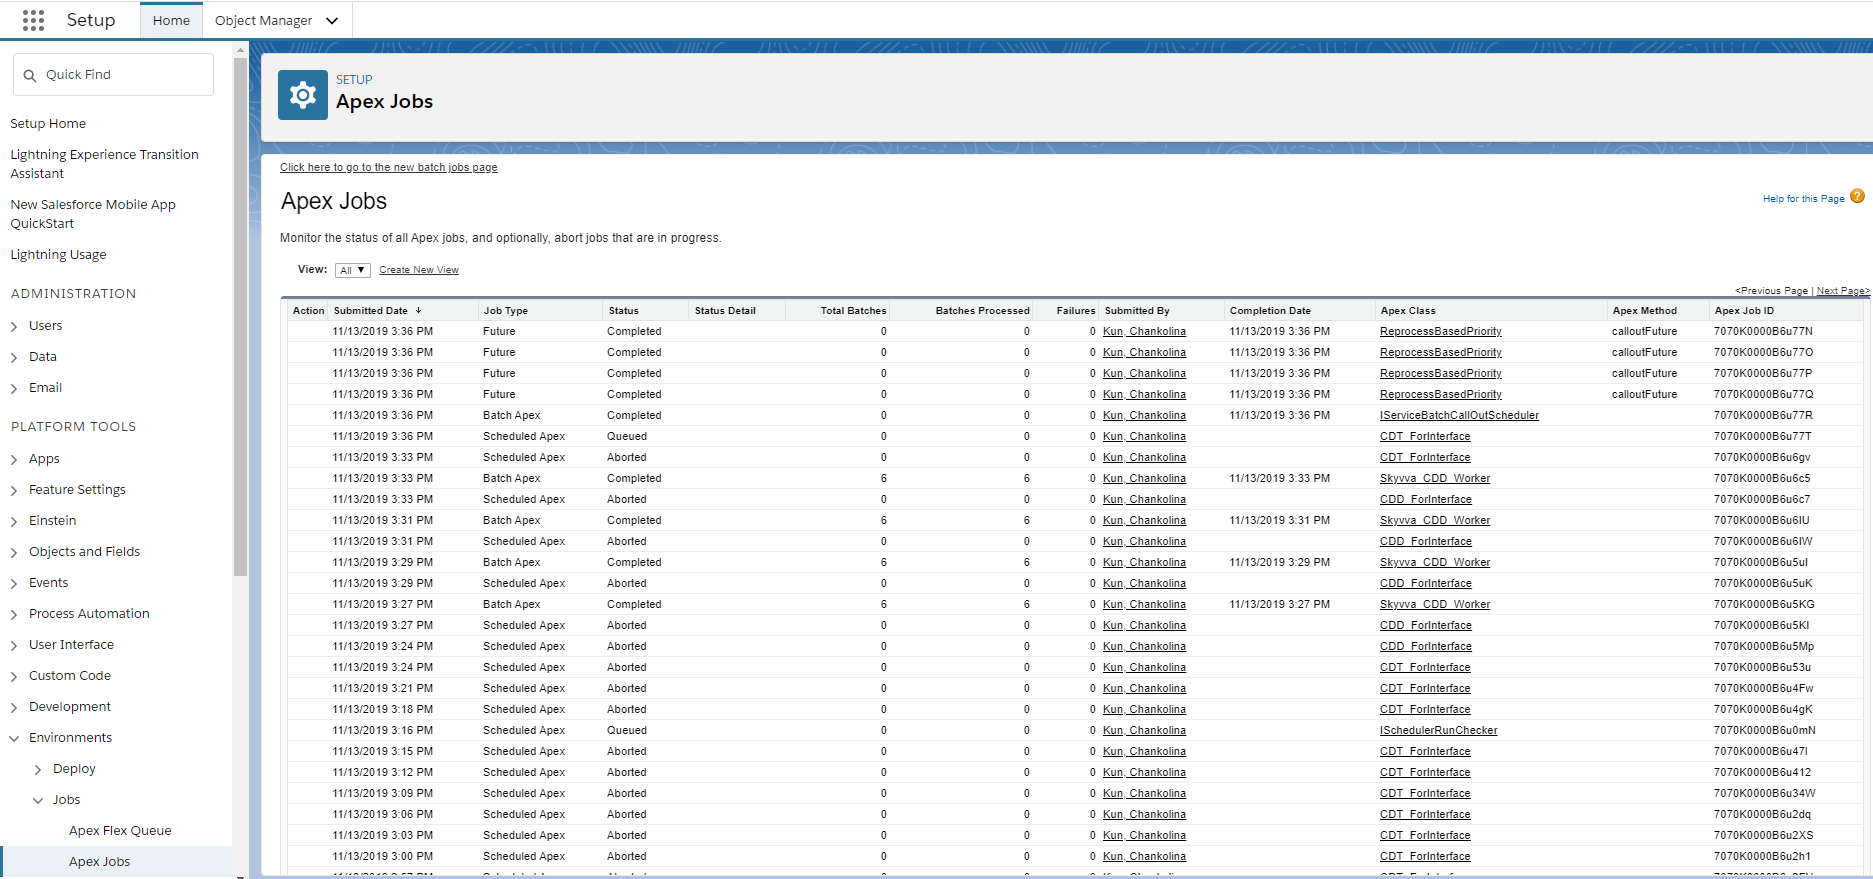
 Step7:Monitor CDT:
- Clicks on Setup -> Jobs -> Apex Jobs
- Enter Apex Jobs Monitoring to see CDT workers:
– Future/Queueable process
– Worker (Batch) Process
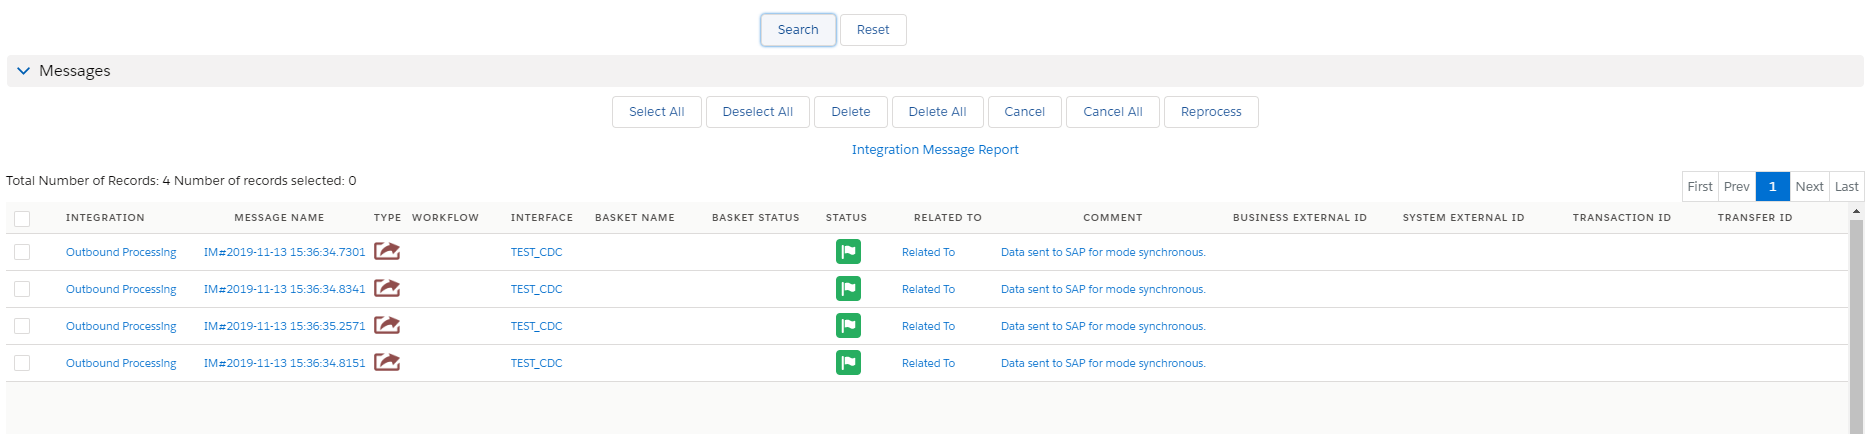
Step8: Check result on message monitoring Board
- Go to Integration
- Click on Messages